THE METHODOLOGY
The Employee Experience Design (EXD) Framework
A systematic approach to diagnosing and removing workplace friction. Seven phases. Ten tools. Built from 30 years of live practice.

THE PROBLEM
Most organisations treat EX as a collection of HR initiatives.
Engagement surveys. Onboarding programmes. Culture workshops. These address the symptoms. They rarely address the cause.
The cause is friction. Specific, identifiable conditions that make work harder than it needs to be. The EXD Framework starts there.
THE FRAMEWORK
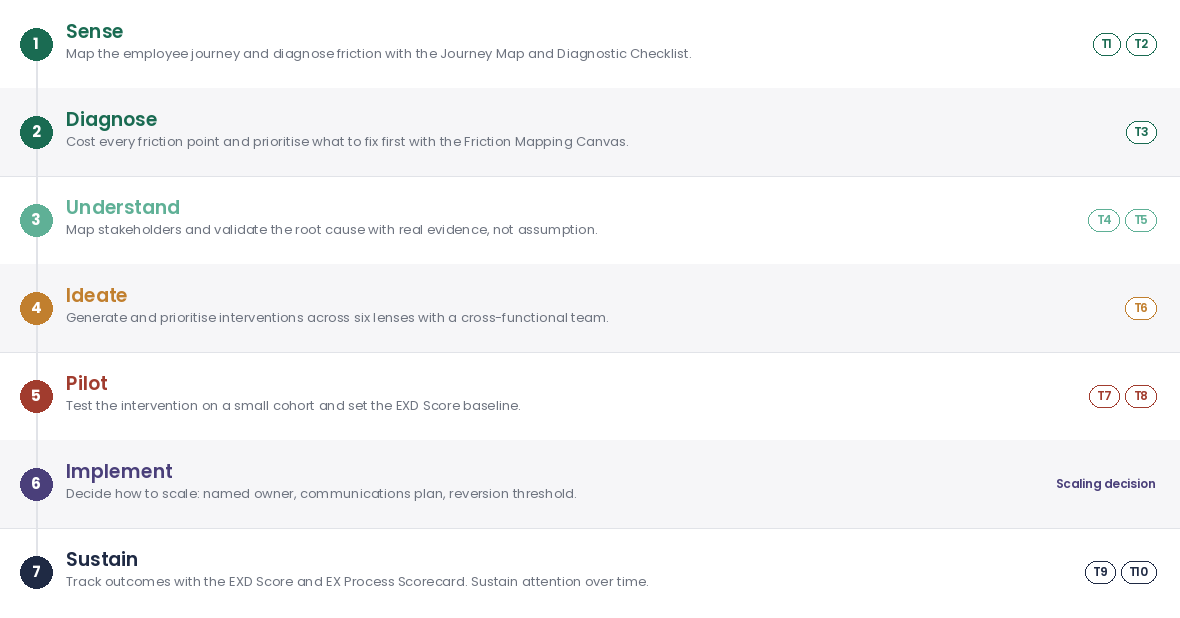
Seven Phases. One Arc.
Each phase has dedicated tools and a specific output. The arc takes an organisation from first awareness of friction all the way through to sustained, measurable change.
Why it is an arc, not a circle
Most frameworks show a loop. We show an arc because organisational change is not cyclical – it is progressive. You do not return to Phase 1 after Phase 7. You go deeper into Phase 2 with better data.
THE SIGNATURE TOOL
The Friction Mapping Canvas
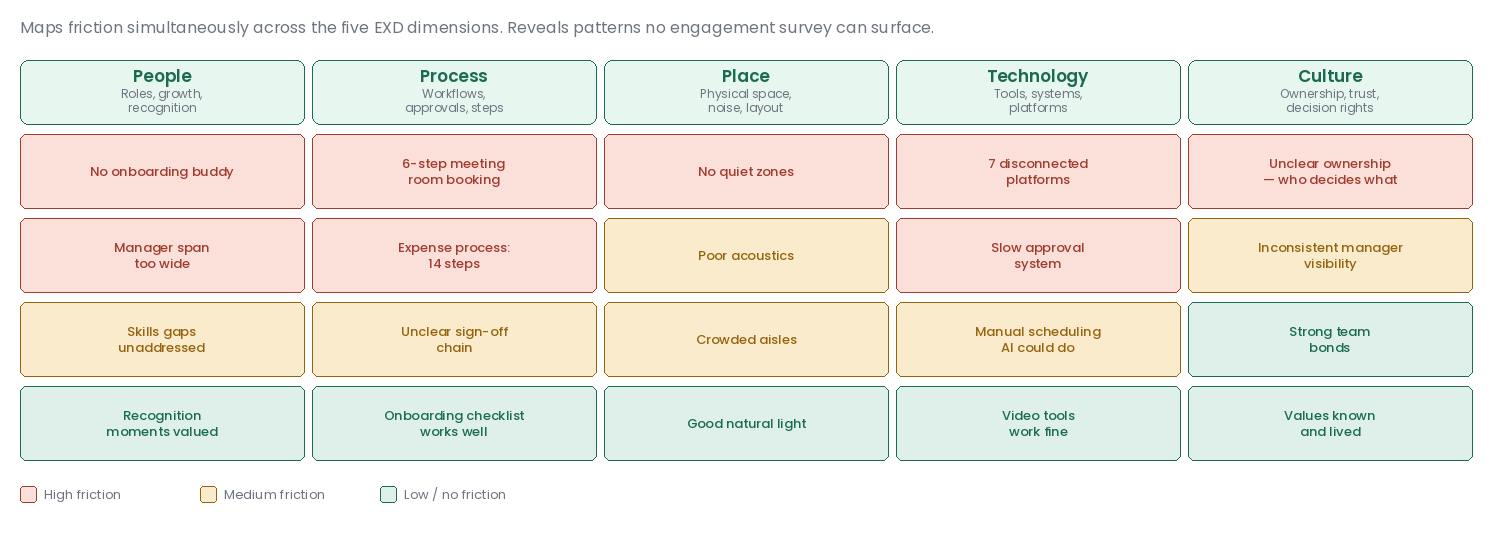
The most distinctive tool in the framework. It maps friction across five dimensions simultaneously, revealing patterns no engagement survey can surface. No other EX framework has this tool. It requires spatial intelligence to run properly. It cannot be faked with sticky notes.
The Friction Mapping Canvas maps friction across five organisational dimensions: People, Place, Process, Technology, and Culture. These are the same categories used throughout the IIT Hyderabad programme, the in-company workshops, and the EXD Score.
Mapping friction across all five simultaneously is what distinguishes the Canvas from a standard engagement survey. Surveys typically surface one dimension at a time, self-reported and averaged. The Canvas cross-references friction location against friction type in a single view, revealing where problems cluster across dimensions — patterns that dimension-by-dimension reporting misses.
THE MEASUREMENT INSTRUMENT
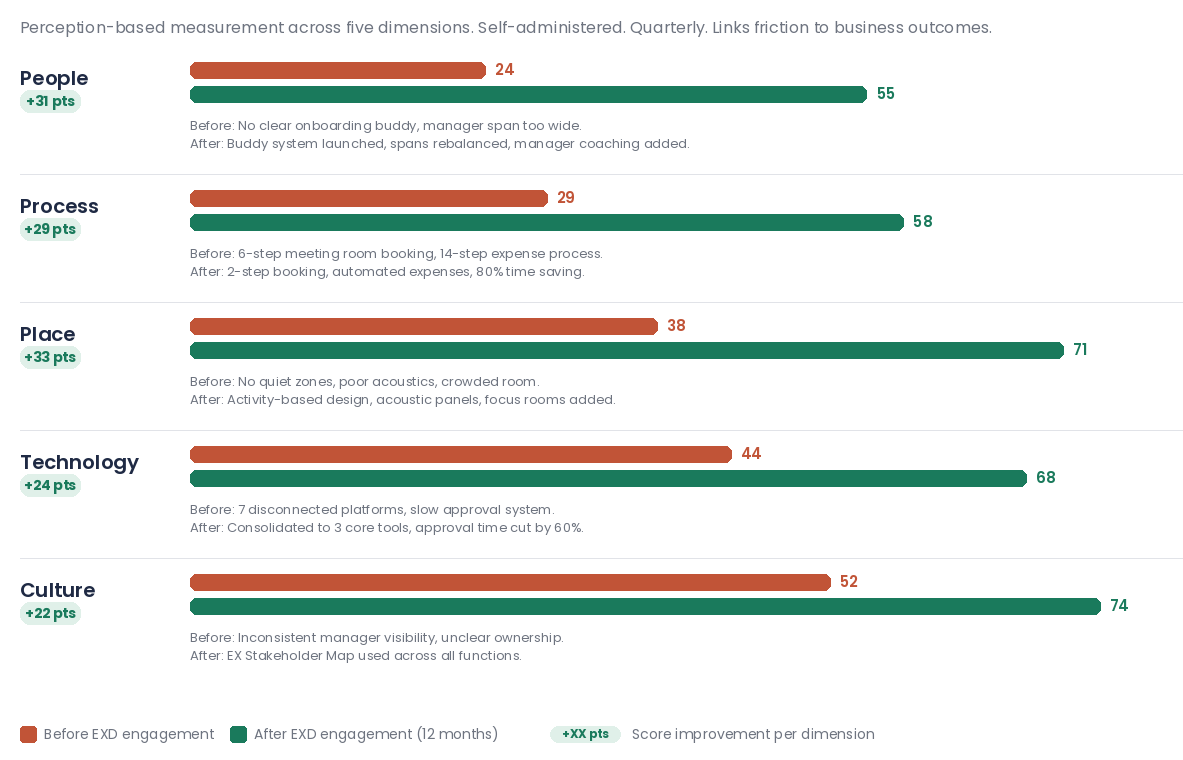
A perception-based measurement instrument that tracks how employees experience work across five dimensions. Run every quarter. Compare over time. Link to business outcomes.
The data visualisation helps you see exactly where friction concentrated before the EXD engagement, and where it reduced after.
IN PRACTICE
The tools in the framework have been run with real leaders in real organisations. The IIT Hyderabad programme is where practitioners learn to use the tools on their own organisations.
