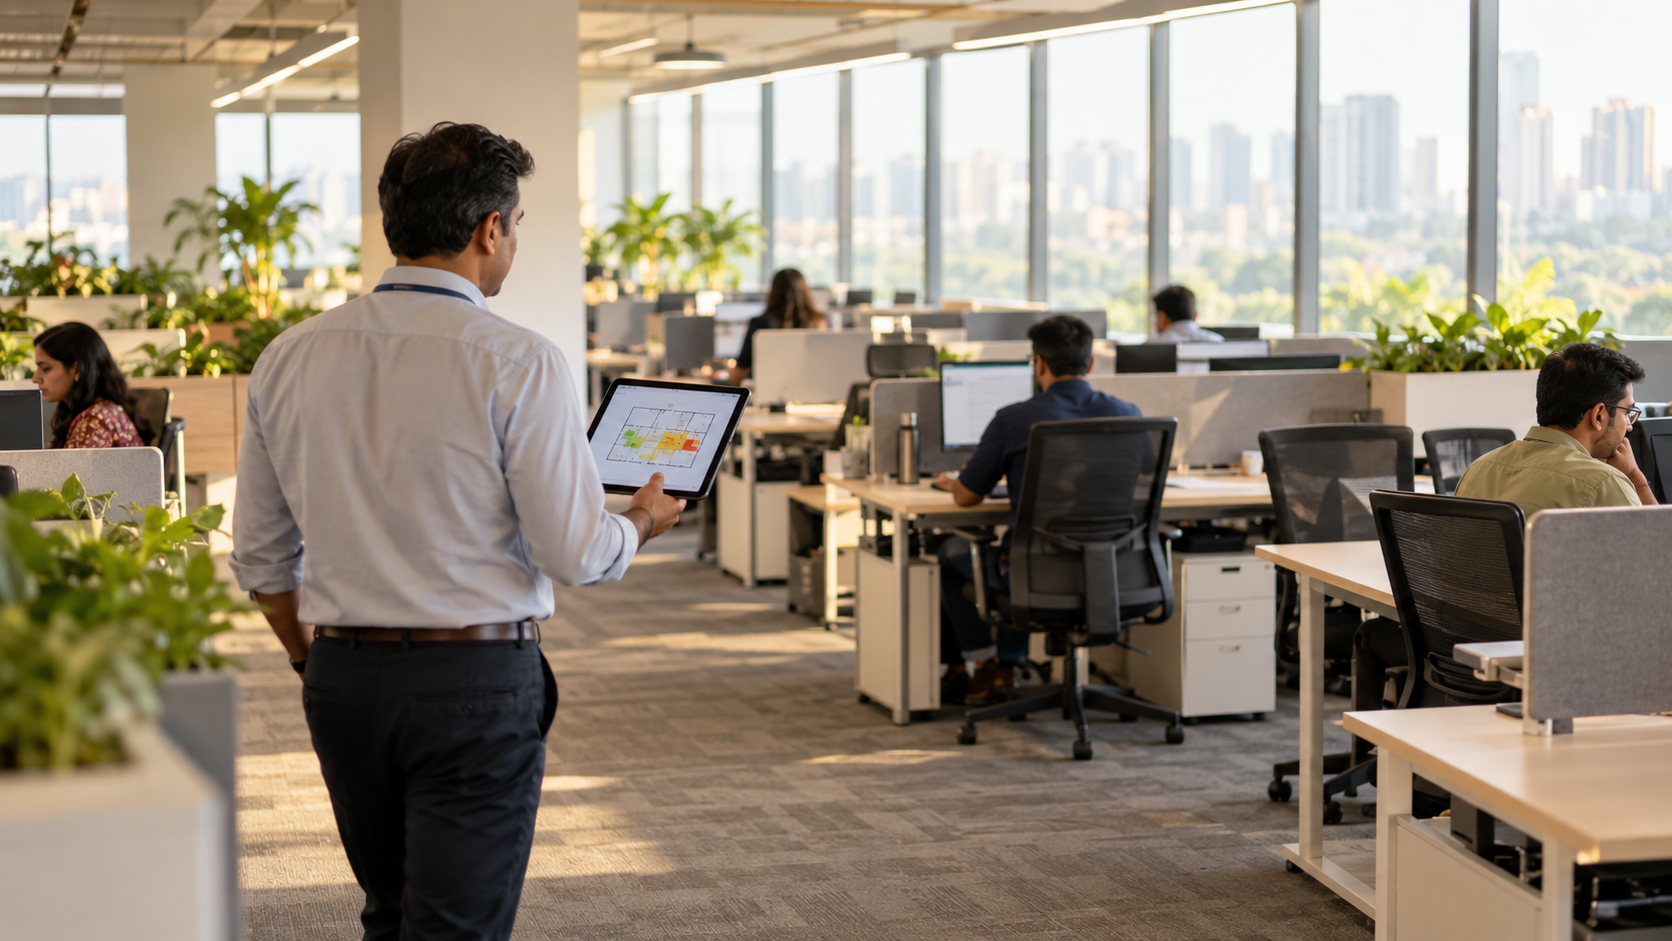
Most organisations pay for every desk, every day, and use far fewer. Office space utilization measures that gap: how much of the space you pay for is actually used, when, and for what. Measured well, it puts real estate decisions on evidence. Measured badly, it leads either to paying for empty floors or to cutting so hard that people arrive to find nowhere to sit.
This guide covers the metrics that matter, how to calculate each one, how to collect the data and how to read the results.
Occupancy and utilization are not the same thing
The two words are often used interchangeably, but they answer different questions.
- Occupancy asks whether a space is in use at all. A meeting room with one person in it is occupied.
- Utilization asks how fully it is used when it is in use. That same ten-seat room with one person in it is occupied but only 10% utilized.
Most office studies report occupancy for desks and both measures for meeting rooms. Keep the distinction clear in any report, or the same building can be made to look full or empty depending on which number is quoted.
The core office space utilization metrics
1. Average desk occupancy
The share of desks in use, averaged across the working day and week.
Calculation: average number of desks in use ÷ total desks × 100.
2. Peak desk occupancy
The highest share of desks in use at any one time during the study. Averages hide the busiest days; peak tells you whether people can find a seat on a Tuesday morning. Plan capacity to the peak, not the average.
Calculation: highest number of desks in use at one time ÷ total desks × 100.
3. Desk-sharing ratio
The number of desks per employee. A ratio of 1.0 means everyone has a desk; 0.7 means seven desks for every ten people.
Calculation: total desks ÷ headcount assigned to the space.
4. Meeting room occupancy and utilization
Measure both how often rooms are in use and how many seats are filled when they are.
Calculation: hours in use ÷ hours available × 100 for occupancy; average attendees ÷ room capacity × 100 for utilization.
Also compare booked hours with hours actually used. A large gap usually means rooms are booked and then abandoned, which makes them look scarce when they are not.
5. Space per person and per desk
Usable floor area divided by headcount, and by number of desks. These figures connect utilization to cost and allow comparison between sites.
6. Cost per occupied desk
Total annual occupancy cost (rent, maintenance and services) divided by the average number of desks in use. This is the number that gets a CFO’s attention: it shows what each desk actually used is costing, not what each desk built costs.
7. Setting mix against demand
Compare the share of each type of setting you provide (open desks, focus rooms, small and large meeting rooms, collaboration areas) with the share of time each is used. Offices designed before hybrid work often have too many individual desks and too few small rooms for two to four people.
8. How employees experience the space
Utilization data shows where people are. It does not show whether the space helps them work. A floor can be fully occupied and still full of friction: no quiet space, rooms that are hard to book, poor acoustics. Pair the numbers with a perception measure such as the EXD Score, which tracks how employees experience Place alongside People, Process, Technology and Culture.
A worked example
Take an office with 400 desks and 600 employees. A two-week study finds an average of 180 desks in use, with a peak of 260 on Tuesdays and Wednesdays.
- Average desk occupancy: 180 ÷ 400 = 45%
- Peak desk occupancy: 260 ÷ 400 = 65%
- Desk-sharing ratio: 400 ÷ 600 = 0.67
Even on the busiest day, 140 desks sit empty. That does not mean 140 desks should go. Before cutting, check what the peak days are for, whether teams need to sit together, and what people who stay away say about the office. (The figures here are illustrative.)
How to collect utilization data
- Observation studies. Observers walk the floor at set intervals, often hourly, over one to two weeks and record which settings are in use. Low-tech and detailed, and a good one-off baseline.
- Badge and access data. Shows who entered the building and when, but not where they sat or for how long.
- Wi-Fi and network data. Gives floor-level presence at low cost, without desk-level detail.
- Occupancy sensors. Desk and room sensors give continuous, granular data. Best for ongoing measurement, with a higher set-up cost and privacy concerns to address openly.
- Booking system data. Useful for rooms and bookable desks, but it measures intent, not use. Always compare it with actual occupancy.
- Employee surveys. The only method that explains why. Use it alongside one of the methods above, not instead of them.
Whichever method you choose, cover at least two full working weeks, avoid holiday periods unless they are typical, and tell employees what is being measured and why. People who suspect they are being monitored behave differently, and that skews the data.
What is a good office space utilization rate?
There is no single right number. Published benchmarks vary widely by sector, region and work pattern, and they keep shifting as hybrid working settles. Use them for context, not as targets.
A more useful test is whether the space is fit for purpose:
- Can people find the setting they need on the days they come in?
- Does peak occupancy come close to capacity without regularly exceeding it?
- Are meeting rooms used at sizes that match their capacity?
- Is the cost per occupied desk falling over time?
If peak occupancy is well below capacity, there is room to consolidate. If peak occupancy regularly runs close to full, cutting desks further will create friction, however low the average looks.
From measurement to decisions
Utilization data is the start of a workplace decision, not the end of it. The usual sequence is:
- Diagnose. Combine utilization data with employee input to see where the space works and where it gets in the way.
- Decide. Choose between consolidating, restacking, changing the setting mix or adding capacity.
- Design and pilot. Test changes on one floor or team before rolling them out.
- Manage the change. Shared desks and new layouts fail without clear communication and new team norms.
- Measure again. Repeat the study after the change to confirm it worked.
iDream’s workplace strategy engagements follow this sequence. When you need evidence before committing to a larger change, the EXD Audit combines space data with a structured diagnosis of workplace friction. For moves and redesigns, see our approach to workplace change management.
Frequently asked questions
How is office space utilization calculated?
The most common measure is desk occupancy: desks in use divided by total desks, expressed as a percentage. Report both the average and the peak, because they lead to different decisions.
What is the difference between occupancy and utilization?
Occupancy shows whether a space is in use. Utilization shows how fully it is used. A ten-seat room with one person in it is occupied but only 10% utilized.
How long should a utilization study run?
At least two full working weeks in a typical period. Ongoing sensor-based measurement gives a better view of trends over months.
Which metric matters most for reducing real estate cost?
Peak desk occupancy, because it shows how much space you need on the busiest days. Cost per occupied desk then shows what the unused space is costing you.
Should we use sensors or an observation study?
An observation study is a quick, low-cost baseline. Sensors suit ongoing measurement across several sites. Many organisations start with a study and add sensors once they know what they need to track.