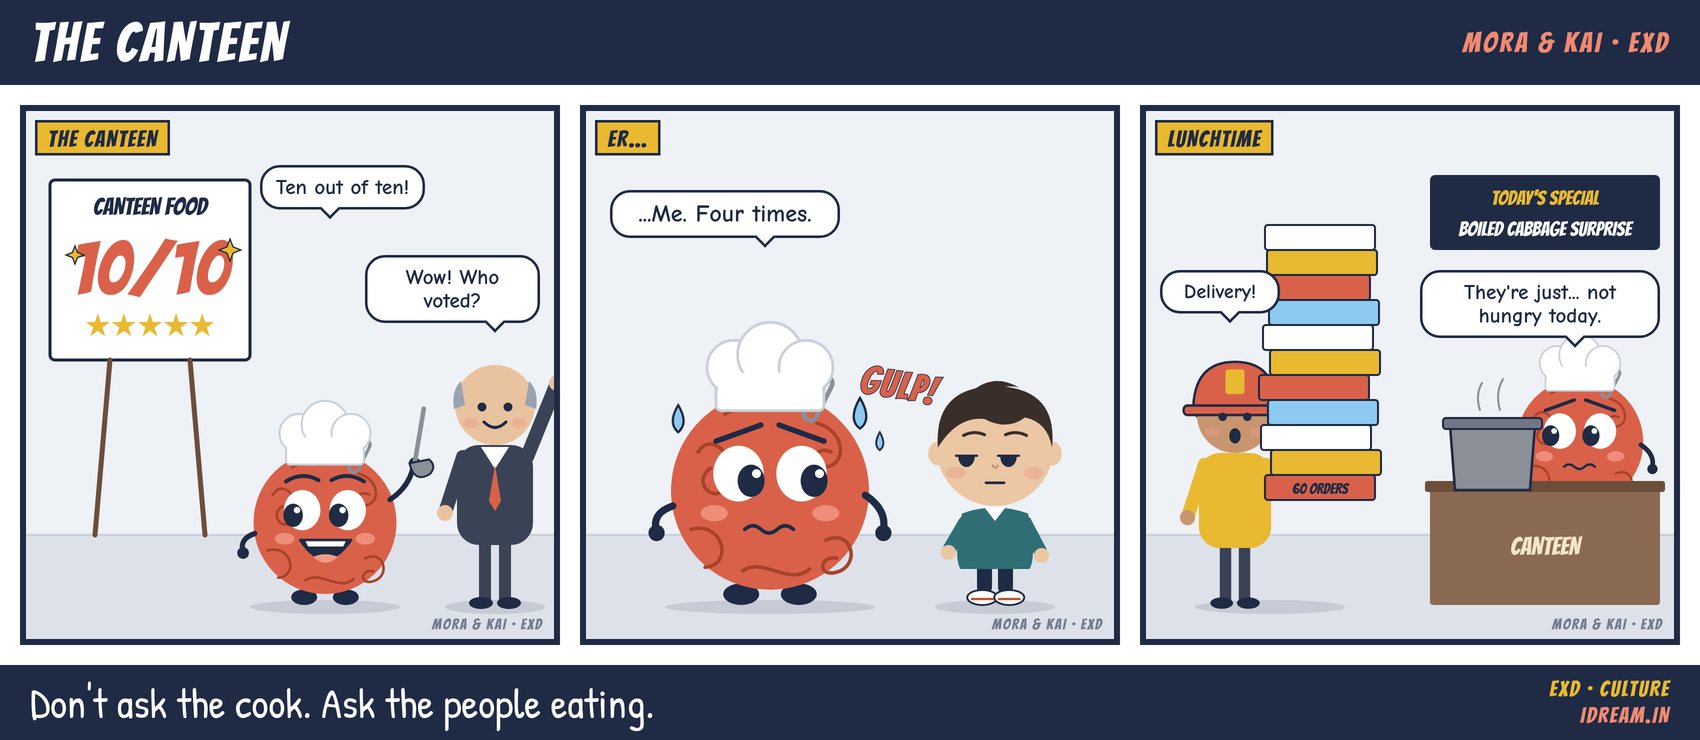
“Ten out of ten!” The canteen’s satisfaction score was perfect. It also had four votes, all from the cook. Meanwhile, sixty lunch orders from food delivery apps were stacking up at reception.
Swap the canteen for the intranet, the travel desk or the new hybrid policy, and the joke gets less funny. Plenty of workplace dashboards are green because the people who built the service are the ones scoring it. The people using it are busy finding something else.
Why it happens
Call it builder bias. When you have designed something, you know what it was meant to do. You remember the constraints and the budget battles. When you judge it, you are judging your intentions, and intentions always look good.
Users never see intentions. They see a slow queue and a dal that is cold by 1:15. They are judging the experience, and that is a different thing to measure.
Organisations make this worse in a specific way. The team that runs a service is usually the team asked to report on it. Its budget and its reputation depend on the number. Nobody needs to be dishonest for that number to drift upwards. They only need to ask the people nearest to them, phrase the question kindly and count the responses that arrive.
Meanwhile the unhappy users have stopped bothering. A person who has quietly switched to a delivery app does not fill in the canteen survey. Silence gets read as contentment.
What it really costs
The direct cost is money spent on things people do not use. Rough maths, purely illustrative: if a subsidised canteen costs ₹15 lakh a year and only half of the people it was designed for eat there, roughly ₹7.5 lakh is buying empty tables. The same logic applies to software licences nobody opens and meeting rooms nobody books.
The larger cost is in decisions. Leaders who see a 10 out of 10 do not fund a fix. The problem stays, the workaround becomes normal, and when someone finally raises it, the response is “but the scores are great”. That moment does real damage. Employees conclude that what they experience does not count unless it matches the slide. After that, they stop telling you anything useful.
What to do instead
The good news is that most of the evidence already exists. You do not need a bigger survey. You need to look at what people do.
- Find one behaviour number for each service. Usage, repeat use, queue length, or what people do instead. For the canteen, count the delivery bags at reception. For an internal tool, count logins after the first month. For a policy, count the exception requests. Put this number next to the satisfaction score on every report.
- Separate who builds from who rates. Users rate the service. The team that runs it can comment on the result but should not collect it, frame it or present it alone.
- Run a one-week comparison. Pick a single service. On Monday, write down its official score. Through the week, gather the behaviour: who uses it, how often, and what the workarounds look like. On Friday, put the two side by side in front of the person who owns the budget. Where they disagree, believe the behaviour and go and ask why.
None of this requires a new system. It requires someone senior to be curious about the gap rather than comforted by the score.
Through the EXD lens
This sits under Culture in the EXD Framework, because it is ultimately about whose view counts. A useful test of any culture is whether the official story and the lived experience match. The EXD Framework is built to show that difference: what leaders believe is happening next to what employees report. Measured once, the gap is interesting. Measured regularly, it tells you whether you are listening better or simply scoring yourselves more generously.
Try this tomorrow: choose one service your team runs, find one number for what users actually do, and put it beside the satisfaction score.
Mora & Kai is a cartoon series from iDream about the small frictions that make work harder. Each strip maps to one of the five dimensions of the EXD Framework: People, Process, Place, Technology and Culture.
Where is friction building up in your organisation? An EXD Audit finds it and puts a cost on it. Or bring your leadership team to the next IIT Hyderabad executive programme on employee experience.